
83% Error Margin: What Claude's HR Plugin Gets Wrong About Comp Benchmarking
Last week, Anthropic launched a Claude plugin for Human Resources, promising AI-powered salary benchmarking, job offer drafting, and more. The compensation benchmarking caught my attention. It's a space dominated by established providers like Aon, WTW, and Korn Ferry, and I wanted to know whether Claude could genuinely compete. So I put it to the test.

Executive Summary: Claude's Compensation Benchmarking Is Not Ready for Prime Time
Perhaps I gave it away in the title but Claude’s comp analysis is highly inaccurate. When benchmarked against real-time salary data, it correctly identified salaries in less then 20% of instances, and critically mismatching salaries in over 60%.
Claude performs especially badly in senior roles, underestimating compensation by 50–80% at the IC Senior level across all three job families tested. Using Claude’s output uncritically for senior hiring decisions risks setting offers that are far below market, with real consequences for both offer acceptance and pay equity.
The pattern is not random. Claude systematically compresses salary ranges, meaning it sees a smaller gap between junior and senior pay than actually exists in the market, and a narrower spread between the lowest and highest earners within any given level. The further up the seniority ladder you go, the more Claude's figures diverge from reality. This means the error does not average out across a workforce: it concentrates exactly where compensation decisions are highest-stakes.
The cause is straightforward: Because Claude draws on publicly available internet data rather than actual payroll records, it has reasonable coverage of average and entry-level roles where salary data is widely reported. But for senior individual contributors and specialist managers (roles that command premium salaries precisely because they are scarce) public data is thin, and Claude simply doesn't have enough signal to estimate these ranges accurately. The result is not a small rounding error. It is a systematic blind spot at the top of the market.
What this means in practice:
- For junior roles, Claude's output can provide a rough orientation — but treat it as a starting point only, not a reliable benchmark
- For senior roles, don’t trust Claude's figures. The data (see below) suggests 50-80% underestimation at the top end
- Do not use Claude as a standalone input for compensation decisions. It is not reliable.
With that out of the way, let’s look at the actual method, data, and results!
Method
I compared three job families across 7 seniority levels, ranging from junior individual contributor (IC) to senior executive, covering Account Management/Customer Success, Software Engineering, and Accounting. These are mainstream roles with broad market representation.
To validate Claude's output, I used Ravio as my benchmark. Ravio supports real-time benchmarking across 46+ countries, and integrates directly with payroll data, making it one of the more reliable real-time compensation sources available. It provides salary distributions at the P10, P25, P50, P75, and P90 percentiles.
The comparison was scoped to the Dutch technology sector, focusing on base salary only (equity compensation remains relatively uncommon here compared to US tech markets, so that's kept out of the picture). With an active workforce of around 9.6 million people and over 1.6 million employed in the broader tech sector, the Netherlands offers a labor pool comparable in scale to a major US tech metro. With 44% of tech employees being of international origin, salary benchmarks reflect genuine market-rate competition for talent rather than a closed domestic pool.
How Claude generates compensation data
In contrast to established providers like Ravio, Claude doesn’t pull from a proprietary salary database. Instead, it draws on two sources: its training data, which includes historical snapshots of public salary databases, and live web search, which pulls current data from sources such as Glassdoor, PayScale, Levels.fyi, LinkedIn Salary, and annual salary guides from staffing firms like Robert Half. This approach could work in markets with a high degree of pay transparency, where public salary data is abundant and well-reported. When public salary data is sparser, Claude is effectively working with a smaller, less representative sample, and showing gaps.
Analysis and results
To assess Claude's accuracy, I ran three separate analyses on the data.
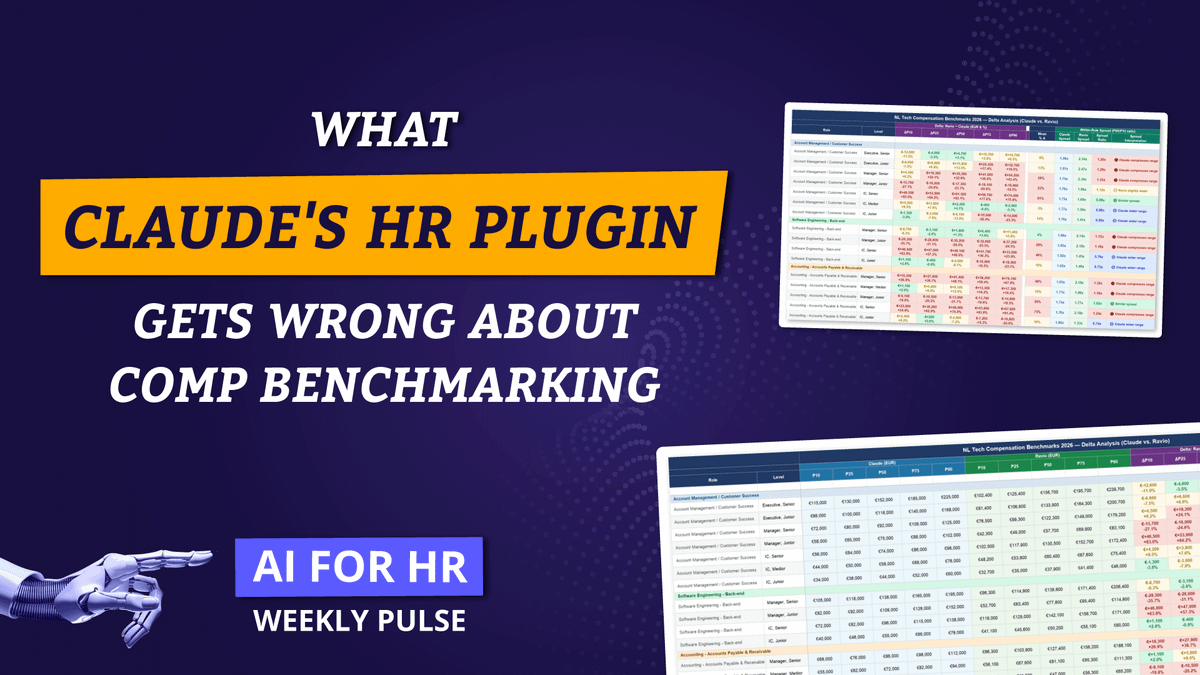
The first was a straightforward delta calculation: for each role and seniority level, I compared Claude's output against Ravio's figures at five percentile points, calculated the difference in both euros and percentage terms, and flagged results as a close match (within ±5%), a mismatch (5–15%), or a critical mismatch (>15%).

The results were stark, with 16% being a close match, 23% a mismatch, and 61% being a critical mismatch.
To explain what causes the mismatch, I followed up with an analysis to test whether Claude has a structural compression problem: does Claude struggle to capture the full spread of salaries within a role, or does it underestimate how much compensation grows between seniority levels?
Within-role spread: for each role, I compared how wide Claude's salary band is versus Ravio's. A compressed band means Claude sees less distance between the lowest and highest earners at a given level, regardless of whether the midpoint is accurate.

Seniority progression: for each job family, I modelled how steeply salary grows as you move from junior to senior. If Claude's curve is flatter than Ravio's, it points to a ceiling effect: Claude anchors too strongly toward the middle and underestimates how much senior roles command in a competitive market

The within-role and seniority findings reinforce the same conclusion. Claude's salary bands are narrower than Ravio's at senior levels. This means it underestimates not just the midpoint, but the full range of what senior talent can command. And when modelling how compensation grows across seniority levels, Claude's curve is consistently flatter than Ravio's, particularly in IC tracks where the gap between junior and senior pay is steepest in the real market.
For practitioners, this matters: it's not just that Claude's P50 is off. Claude's entire picture of senior compensation (the floor, the ceiling, and the distance between levels) is compressed. A hiring manager relying on Claude's output for a senior IC role would not only lowball the offer, but would have an inaccurate sense of the range to negotiate within.
A full overview of the underlying data and analysis is available here.
A fair hearing: Claude's own limitations
I figured I should be fair and ask Claude to share its perspective on these results. Here’s Claude:
When prompted, Claude is transparent about the constraints of its approach. It acknowledges that its salary data is derived from publicly available sources that vary significantly in quality and coverage by region, that its training data has a cutoff date, and that self-reported salary figures are subject to reporting bias. It explicitly recommends cross-referencing its output with dedicated compensation platforms before making hiring decisions. In other words, Claude does not claim to be a compensation benchmark. The problem arises when its output is taken at face value— which, given how confidently the numbers are presented, is an easy mistake to make. The gap between how the output looks and how reliable it actually is may be the most important limitation of all.
In conclusion, AI-powered HR tools like Claude offer ways to compress the HR tech stack; however, excitement shouldn't replace scrutiny, especially when the output drives decisions that directly affect people's livelihoods. That makes me wonder: should tools like this come with a warning label?